


As you know, to be profitable – trading in financial markets must be systemic. The trader should always evaluate the results of his trading through the prism of a number of key indicators of the performance of the trading system. But analyzing the results of trading on reports from the terminal manually, as a rule, makes this occupation difficult, time-consuming and not informative. But to help the trader will come specially designed services on such well-known sites as Myfxbook and FXBlue. Which allow you to connect to the trading terminal and copy not only the history of trading, but also the current transactions with different latency. At the same time these services are very popular among traders all over the world, and are a truly amazing exhibition of achievements, there is no economy as you most likely continued in your mind. And the results of trading real traders using completely different financial instruments, strategies, brokers, trading robots, trading hands, on real and demo accounts. All this variety of trading results are stored on their memory dumps these services.

As you may have guessed that this information is absolutely priceless, not only for novice traders, but also for more experienced colleagues in this craft. It is always easier to learn something new, using the experience of others. Trading account monitoring can contain very useful information, firstly, if the monitoring is open, you can try to identify what kind of trading approach and system are used in this account, and secondly compare the results of the same trading systems installed by different brokers, thirdly if you are an investor and plan to invest in this account or by means signal service to copy the transactions, you can analyze the trade and draw certain conclusions. This list can be continued for a very long time, everyone will find the use of this statistic.
Assessing the value of this information, the DaVicniFX Group team developed the MyFxBook Show Trade Historyscript, which allows copying the trading history from myfxbook trading account monitoring to Meta Trader 4 trading terminal. Working with this script is absolutely simple and intuitive.
An example of a script
Let’s take a specific look at how this script works in practice. As a prototype, we will take the same developed profitable trading advisor Zodiaq EA and try to copy the results of the trade from the real account, which is monitored on the MyFxBook website.
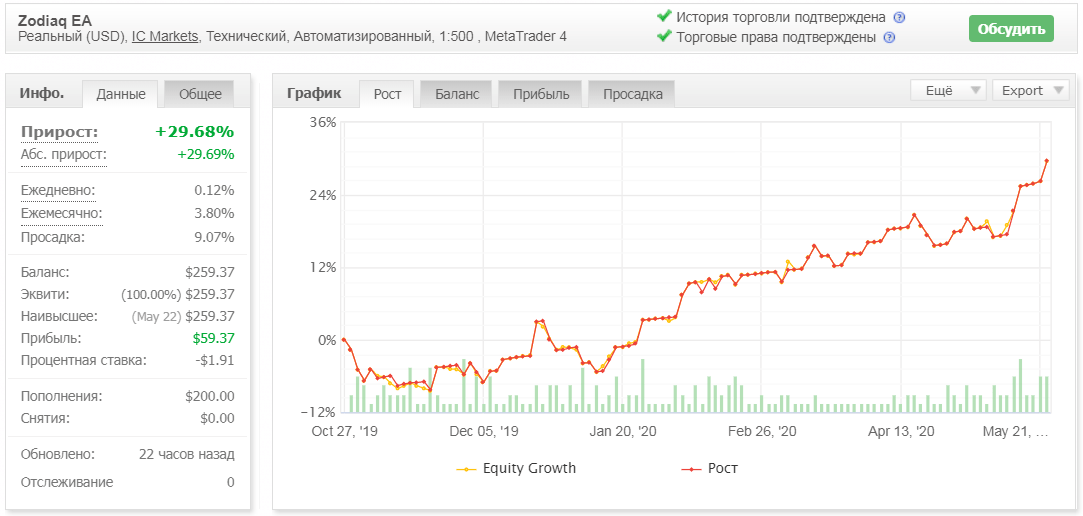
As can be seen in the graph, the line of balance change has no protracted and deep drawdown, directed clearly diagonally to the top right corner. Accordingly, we conclude that the results of this trading system are interesting and would not hurt to analyze them additionally, and if you do not buy this trading algorithm, then at least try to identify the concept and try to repeat something similar.
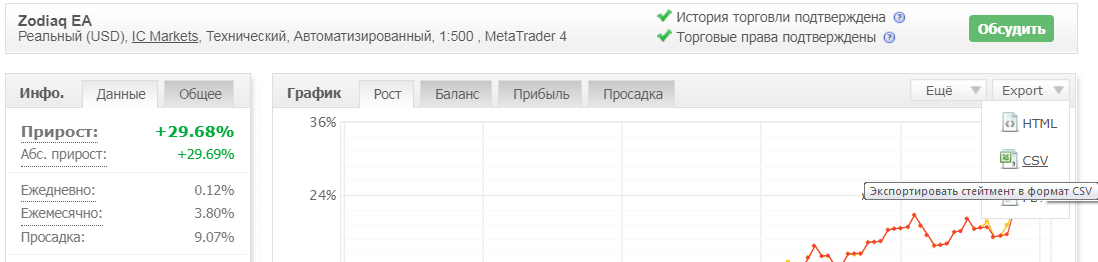
First of all, we will unload the trading data from this monitoring, for this in the top right corner above the chart click Exportbutton, in the drop menu we will choose the format in which the export of the state (trade results report) will be exported, in our case it is a csv file.
This file is stored in the root catalog of the Meta Trader 4 terminal, namely the Filesfolder, which can be opened by clicking ‘File’ – > ‘Open the data directory’. We have this path to the data terminal has the following kind:
C:\Users\Admin\AppData\Roaming\MetaQuotes\Terminal\<Directory Name>\MQL4\Files

After that, we go in the terminal to the window of the navigator, and double-click the left mouse button on the script, or dragging on the graph, activate it.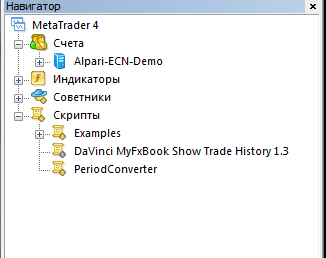
In the script settings menu, in the History File name, we spell the name of the downloaded file, in our case it is Zodiaq-EA-statement.

Next, let’s go through the settings of the script. Since the trade on our account was one adviser Zodiaq EA the same time, on one currency pair, the parameter Magic Numbers we leave empty, but if trading was conducted by different trading advisors with different Magik numbers (and they would be allowed to be viewed by the trader on the MyFxBook site), we would be able to differentiate those numbers that we would like to display on the chart, for this we would need to write a list The magic numbers of closed orders through the comma, which need to be displayed on the chart. At the same time, the script itself will open the schedules of those trading pairs, on which the report has a history of trading.
The number of days of trading order history that you need to load can be changed by setting up Load history days,in our case we will set it equal to 30 days. If the trade has been conducted for more than a year, and you want to display absolutely all the trades, then you will have to be patient, because the script needs time to analyze this amount of data.
The Hour GMT Shift settings option allows you to set a time shift, thereby synchronizing unloaded data from Myfxbook and currency pairing data in your terminal. For example, if you traded on a broker’s account with a time shift of GMT-1,and you have in the terminal quotes of a broker that works on the time of GMT 3,you will need to set this Hour GMT Shift parameter at 2. This will synchronize the history of opening and closing orders over time.
Since we use only one EURUSD currency pair in our trading on the monitoring in question, we will not change anything in the Choose Symbol parameter, we will leave the current Symbolvalue. But at the same time, for ourselves, we note that if the unloaded report had a history of trading on different currency pairs, the installation of the value of All All would unload the entire history of orders for all currency pairs. At the same time, the charts of these currency pairs would be automatically opened.
Since trading in an advisor The EA is carried out using deferred orders (Wewill be particularly interested in information about where they were installed, and we will activate the setting for this purpose. Show Pending Ordersas well Show Orders TP/SL Line,which will allow us to display short stretches of price Take Profit and Stop Loss next to the opening price of the order.
Also a very useful feature of the Show Profit Labelsparameter , will reflect the income and loss over the closing price of orders, as well as the total income/loss on the current pair. Based on the analysis of these data, it will be possible to draw conclusions what money management is used on the trading account.
The graphics visualization setup will personalize the view of lines, font, and other scripted information.
We’ve fully adjusted the script settings, and after clicking the OK button, the process of replication of the account history data on the graphics in the terminal will begin.
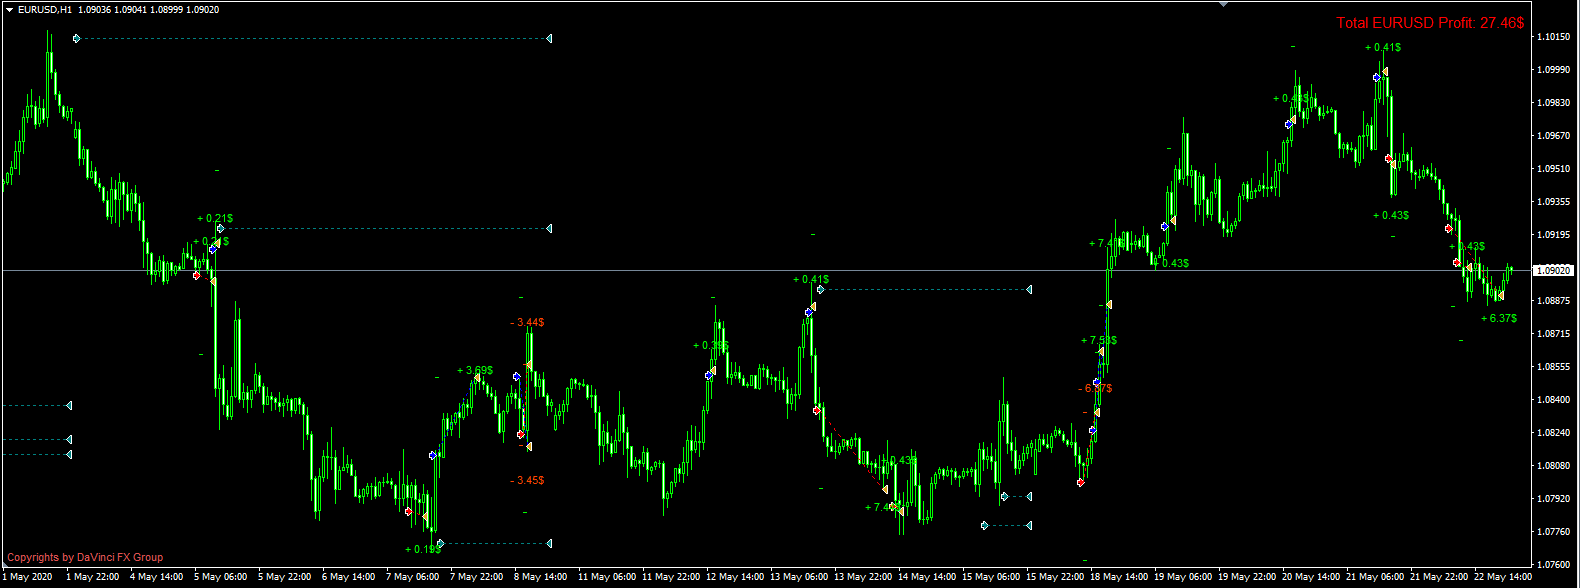
To find out the lot of the trading order, you need to bring the mouse to the open triangle icon of this order, there will be an information window with the name of the object and the value of the trading lot. If the trader has opened up to the orders comments in the settings, they will also appear in the title:

An additional feature of the script is to calculate the total income or loss on the current symbol during Load history days. The data is displayed in the top right corner in the form of interest, or in the currency of the deposit, depending on the settings.
To clear the chart of the received graphic elements, you can use our script DaVinci Delete all objects from chart. It will easily be able to remove all objects, or only those that contain a certain name, analyzing current or all open graphs.
If you need to quickly close all the new charts after viewing the trading history, then use the DaVinci Close all charts script.
Script settings:
| History File name | The name is .csv of a file downloaded from myfxbook in the Files folder. |
| Magic Numbers | A list of Magik numbers of closed orders through a comma that needs to be displayed on the graph. If you leave the graph empty, all orders will appear. |
| Load history days | The number of days of trading order history that need to be loaded. At 0, the whole story is loaded. |
| Hour GMT Shift | Shift the opening/closing time of trading orders relative to your broker’s GMT and data from the Myfxbook website. |
| Signal Prefix | Prefix a currency pair if it is available from the broker on which the trading account works. |
| Signal Postfix | Postfix of a currency pair, if it is available from the broker on which the trading account works. |
| Choose Symbol | Choosing a currency pair to download data: Only the current pair (Current Symbol), or all the characters that are in presence on this monitoring (All Symbols). |
| Chart TimeFrame | Select the timeframe of all the charts that will show the trading history. |
| Show Pending Orders | Show unactivated pending orders on the chart. |
| Show Orders TP/SL Line | Show short price segments of Take Profit and Stop Loss next to the opening price of the order |
| Show Profit Labels | Show income and loss over the closing price of orders, as well as total income/loss for the current pair. |
| < < Design Settings > > Appearances | |
| Line Width | The thickness of the line from the opening price to the closing price. When more than 1 style line is longer, always “Solid Line.” |
| Line Style | The style of displaying the line between the opening price and closing of the order at LineWidth 1: Solid Line, Stroke Line, Dotted Line, Dotted Line, Double Point Bar. |
| Font Size | The size of the profit/loss font on orders. |
| Buy Orders Color | The color for the triangle that marks the opening of the order, as well as the color of the line that connects the closing price of the order for purchases. |
| Sell Orders Color | The color for the triangle that marks the opening of the order, as well as the color of the line that connects the closing price of the order for sales. |


