


The DaVinci Spread Detected indicator is designed to correctly determine your broker’s spread. The resulting data is displayed in a separate window in the form of a histogram. The indicator is conveniently set on the chart and has a minimum of settings. It is useful to compare the spread of different brokers to choose a more attractive account for trading, because no one wants to overpay the broker already hard earned money.
The main difference between our free indicator and analogues on the network:
- considers the average spread for the current bar and displays it as a histogram on any timeframe, as well as the overall average spread from the moment the indicator is installed on the graph in the form of a sloping line between the histogram columns.
- records the spread to the file for a more detailed analysis of the data received in Excel. For example, you can create a time-frame dearly table to compare spread behavior during the day and at night, at a specific hour during a given period.
- reads spread data from a created file with a further construction of a spread histogram on them. Why would you do that? For example, if you accidentally closed the terminal or there was a rupture of communication with the broker – the indicator will restore all the data that is stored in the file, that is, you will always have a clear idea of the spread behavior on the chart in any unfavorable situation.
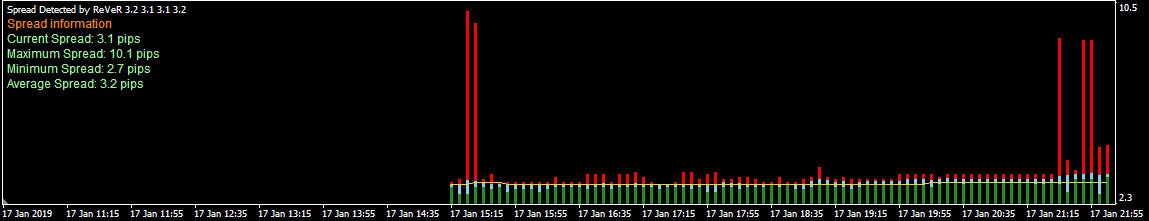
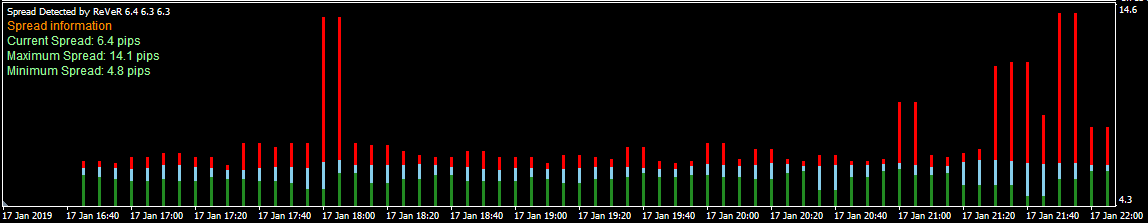 Accordingly, the colors: red – the maximum spread for the current bar, green – minimum, blue – the average for the past bar (i.e. summed up the spread for each tick and is divided by the number of ticks). Well, the yellow line is the average spread for the entire trading period.
Indicator settings:

| >> General settings/filters | |
| Show MaxSpread | Show a broker’s maximum spread histogram |
| Show Average Spread | Display a broker average spread histogram for the current bar |
| Show Min Spread | Display a broker’s minimum spread histogram |
| Show Avr Spread Line | Show the overall line of the broker’s total average spread |
| Show Text Lable | Display the resulting text data of the indicator |
| >> Other settings | |
| Max Spead On Chart (pips) | If the current spread is larger than the specified value, the indicator draws red over the candles. At 0 – off |
| Max Spead On Chart Alert | When true, the setting displays the alert if the current spread is larger than Max Spead On Chart |
| Write Spread File | True, the data was recorded in a file that is located in the folder of “Spread Detected…” |
| WriteTF | The period of recording data in the file. There can be no more than the current Timeframe. (I.e. if your TF M15, then the record should be at least once every 15 minutes, so the set tF for the record must be M1, M5 or M15) |
As you can see, this indicator is very easy to use and will help you in determining the spread of your broker.


4 Comments. Leave new
I have tried the spread detected indicator on my Mt4, may I know:
a) there are four figures in the excel file, what do they represent from the left to the right? The left one seems to be the max of the period, and what are the other three?
Regards
Maximum, Average, Minimum, Average at all.
hi, and for mt5. its work? or do you have another to work in mt5?
Thanks
Hello!
This indicator is designed for the MT4 platform.
For the MT5 platform, we plan to write a similar indicator in the near future.
Subscribe to project news and wait.