


The Growth and Balance indicator is designed to visually display the trader’s trading results directly in the MT4 terminal without the use of third-party websites and programs.
After a long analysis, we have come to the conclusion that online resources for calculating the statistics of trading accounts can not accurately display Equity, which was in the account in the period before its accession to these resources, so the calculation of floating income/drawdown is displayed incorrectly. Growth and Balance indicator analyzes the quotes of your broker, looks at the price history of Close, High and Low all candles on the pairs on which the trading took place, and gives equity data with a minimum error.
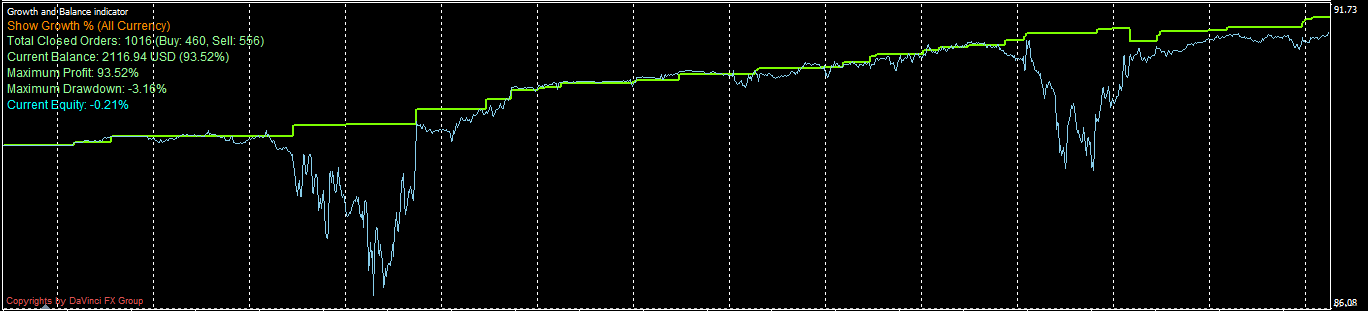
This indicator is convenient for analyzing your trading system, finding its shortcomings, as well as strengths. The program allows you to view the results of trading for all closed trades, as well as on a specific tool, the direction of buy or sell closed trades, as well as individual Magic Number. The indicator displays information in the form of a linear graph and a yield histogram on any timeframe, taking into account both the balance and equity of the trading account. Has three modes of charting: on a percentage of income, account balance, or on profit orders.

General account information appears on the left as a disconnected text. It also takes into account the filters of your settings, the total number of trades and profitability.

In account balance display mode, the indicator also displays top-up/withdrawals, as seen above in the screenshot of our PAMM account.


Note:
-
Before using the indicator, connect your trading account in the terminal (also applies to the testing mode).
-
When testing in visualization mode, the date should not be specified until the actual start time of trading on the account.
-
In the Account History window, you need to display the whole story (right-hand mouse – “The whole story”).
- In the settings, you need to allow DLL imports.
-
Because MT4 does not have the ability to programmatically load the missing quote history, you need to manually scroll through the charts for all the Symbols that were used in the trade, otherwise the Equity line will appear incorrectly. If there is a lack of history, the indicator will write a message in the journal “History bars didn’t load completely” and indicate the necessary initial date of the story.
Indicator settings:

| > Choose Indicator Type | |
| Indicator Type | Three modes of displaying information on completed transactions: |
| 1. GROWTH | Earnings chart as a percentage of the balance sheet. |
| 2. BALANCE | The balance sheet schedule based on the results of the trade, as well as the replenishment/withdrawal of funds in the deposit currency. |
| 3.PROFIT | Income/loss chart in deposit currency. |
| Min Period Count Equity | The timeframe for which Equity will be calculated on the account. The smaller the period, the more accurate the calculation data will be, but the number of downloaded history bars for each pair should be greater. (If you have a longer trading history for more than 2 years, it is advisable to set the value on TF H1/H4). |
| > General settings/filters | |
| Show Currency | Currency pair ingessic: ALL (all), Current Currency (current pair on which the chart is set) |
| Show Orders Type | Choosing the direction for the orders analyzed: ALL (all), Only Buy (purchase only), Only Sell (sale only). |
| Magic Number Filter | Filter by Magic Number. If “ALL Magic” or an empty line is listed, all orders are taken into account. You can specify the specific value of the required numbers magic through a comma (,) for more detailed analysis. |
| Comment Filter | Filter closed deals by order comment. If the field is left empty, all orders will be count. |
| > Display Indicator settings | |
| Show Main Line | Show the main line of trading result by different types of chart. |
| Show Equity Line | Show the account equity line. The calculation goes to all couples who participated in the trade. Doesn’t work in PROFIT mode |
| Show Histogram | Display profit/draw histograms on the account. For a more detailed display of the histogram, it is recommended to use it when the Parameters Show Main Line and Show Equity Line are switched off. |
| Show Text Lable | Display text with information in the left corner of the indicator window. False – off |
| > Alert settings | |
| Alert and E-mail when DD reached | Display Alert on the screen, and send a letter when you reach the specified percentage of the drawdown on equity. At 0 – off. |
| > Other settings | |
| Write Equity to File | Write the real value of the equity to the file to continue loading it when you re-start or remove the indicator from the graph. The recording takes place every 5 minutes. This feature is needed to accurately display the value of floating profits. |
The indicator is conditionally free. Below here you can tell the version for Demo Accounts to see the features of this tool.
To use this tool on real trading accounts, please contribute to the development of the project by contacting support or leave your comment below (it will not be published).
Purchase price: $35


2 Comments. Leave new
Hi! A quick question about your indicator: does it provide real time monitoring of open p&l?? We need to constantly monitor these data because prop firm doesn’t allow open equity lower than 5% of the daily initial balance and mt4 strategy tester (for backtesting) doesn’t monitor it.
Hello!
Yes, in the mode of selecting the appropriate timeframe.