Содержание
DaVinci Colored MACD (Moving Average Convergence/Divergence) – at the heart of this development is a trend indicator invented by the famous new York financier Gerald Apel in the 1980s.
The idea of building an indicator is as simple and elegant as possible. The indicator is a combination of three moving averages. In this case, only two moving averages (Moving Average) of three will be displayed. One, faster line shows a short-term trend (MACD line), the second, slower shows a long-term trend (MACD signalline)
The DaVinci Colored MACD indicator identifies the parity of short-term and long-term market participants’ trade agreement on the current price.
The classic version uses 12, 26 and 9 settings for the price of closing a candle. It was such periods (12 and 26) recommended Appel to enter the sales of the stock market. For purchases, the author recommended using 8, 17 and 5. The user has the right to experiment with the indicator period.
The main feature of this modification is the ability to use an equal distance between histogram bars.
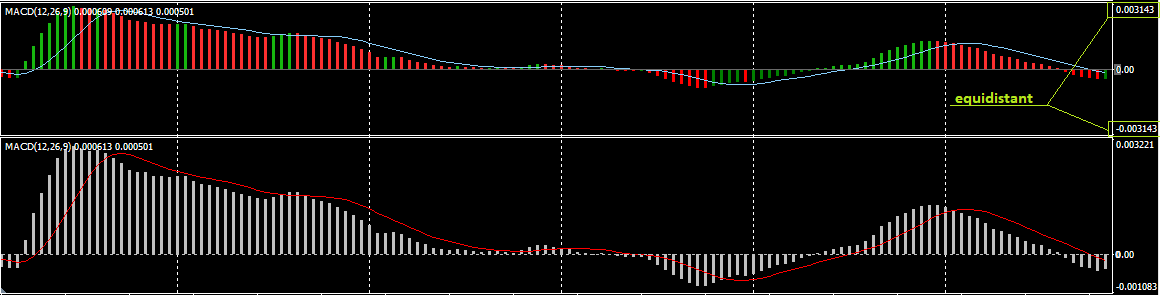
This allows you to more clearly see the trend of price movement, the momentum of the indicator itself and make a more informed decision about entering the market.
An additional feature of the DaVinci Colored MACD indicator is the ability to change the colors of histogram bars. The graphic performance of the indicator provides four colors – increasing and falling histograms both above and below zero. This color visualization setting is especially useful for determining the difference between practical values, as well as allowing you to adjust the perception of the indicator, for faster trading decision making, which is especially important for the trader, who applies scalping trading tactics on the market.
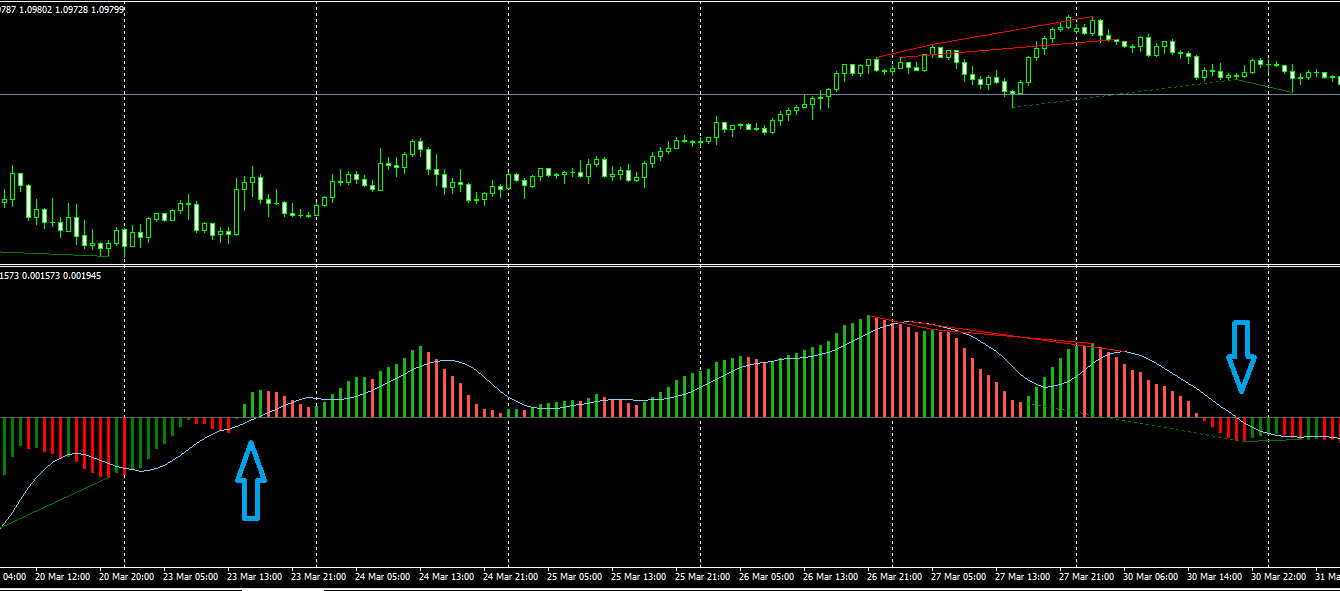
As can be seen in Figure 2, the DaVinci Colored MACD indicator builds a trend line both on the chart of the financial instrument and on the histogram built at its prices.
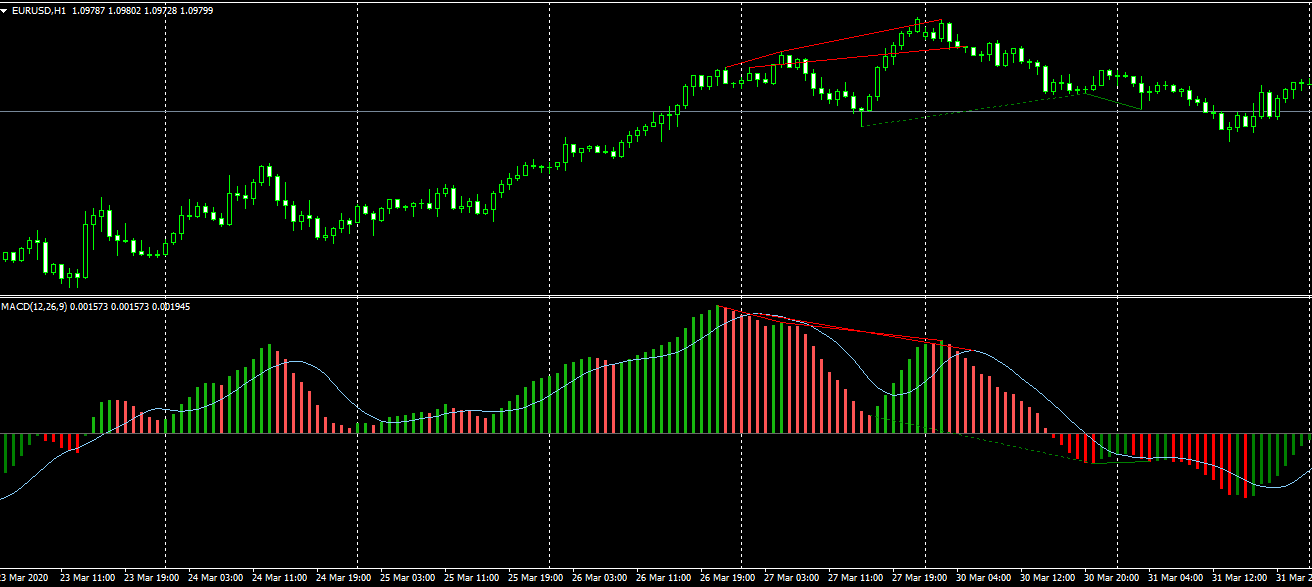
This will be especially useful when identifying the so-called Divergence, a highly effective trading formation in which the trend price peak is higher than the peak on the MACD (Divergence, divergence), it indicates a weakening of the current trend and usually a change in the current direction of price movement.
Indicator signals
Let’s take a look at the main signal groups that DaVinci Colored MACD indicator will give:
- If the columns of the MACD histogram are above the 0 level, respectively, the market is dominated by a bullish trend, the exact opposite of the situation with the bearish trend, the histogram posts are below 0 mark. The higher or lower the level of the pillars, and the distance between them is greater, the stronger the pronounced trend movement.
- The second most important signal of the MACD indicator is the definition of local highs and lows of histogram. They show first of all the state of oversold/overbought financial instrument at a certain point in time and the beginning of the corrective movement.
- The next group of signals alerts the trader about the beginning of a new trend. This is the intersection of the MACD histogram line with the 0 level. In classical trading, this is an unconditional signal to enter. But do not, completely rely on only one given signal, always need confirming triggers.
Indicator settings:
| <Main Options > | |
| Fast EMA Period | A period of rapid exponential moving average. |
| Slow EMA Period | A period of slow exponential moving average. |
| Signal SMA Period | The period of signal moving average and price for calculation. |
| Compare Min/Max | Display a MACD histogram at an equidistant minimum and maximum distance. |
| <Color options > | |
| MACD Above UP | The color of the rising histogram is above 0 mark. |
| MACD Above DN | The color of the falling histogram is above 0 mark. |
| MACD Below UP | The color of the rising histogram is below 0 mark. |
| MACD Below DN | The color of the falling histogram is below 0 mark. |
| <Color Divergence > | |
| Divergence: MACD Histogram | Show a divergence of MACD histogram. |
| Divergence: MACD Line | Show divergence on the MACD signal line. |
| Divergence: Show Classic | Consider the classic divergence. |
| Divergence: Show Hidden | Consider “hidden” divergence. |
Resume
In conclusion, I would like to note that, despite its sewage and simplicity, the indicator DaVinci Colored MACD can be an excellent complementary element of a stable trading system, but it is highly undesirable to build the system only on the signals of this indicator.
Simplicity is the key to success!