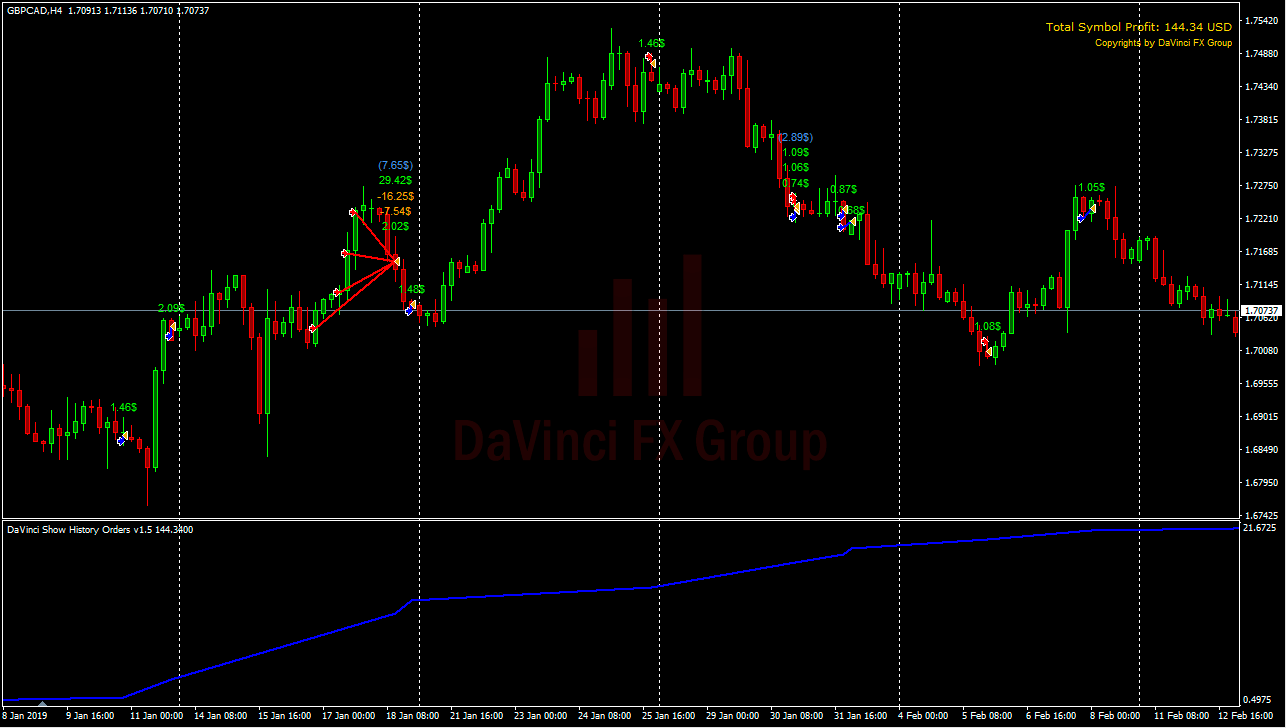
To analyze your trading history, you sometimes just need to view your closed trades on the quote chart. This indicator performs a simple function – displaying already closed orders and updating the data after the next close.
Of course, you can do this manually by simply transferring closed trades to the current currency chart, or transfer all positions at once, having previously pressed the Shift key, but why do the extra things you can do for you. In addition, our indicator is able to show the profit/loss of both each individual order, and the total value of profit (blue in brackets) above the candles where the closure occurred. For example, if you trade a grid of orders with a common take-profit, you will immediately see each individual, as well as the total profit.

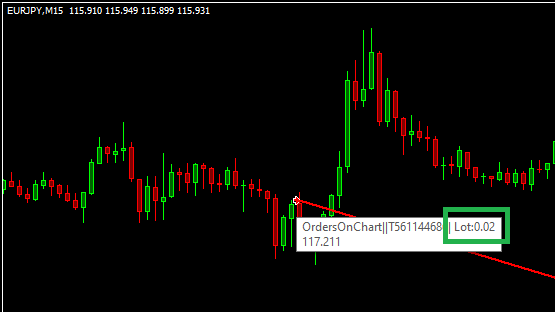
To find out the lot of the trading order, you need to bring the mouse to the triangle of opening this order, there will be an information window with the name of the object and the value of the trading lot:
You can also switch to a higher timeframe, such as D1, and see total profit by day with ShowCandleProfit enabled:

The indicator updates the data every time the next order closes.
If you want to do a more detailed analysis of the trading with a graph-building not only of income, but also of a balance or percentage of profit with an equity line that displays actual drawdown, try our Growth and Balance indicator.
Indicator settings:
| Main Options | |
| Order Magic Number. -1 – all | You can select the Magic Number of displayed orders, or set the value of -1, then the chart will appear all orders for this pair. |
| ShowCandleProfit | If the switch is true, the indicator shows the total profit on the candle if it has been closed more than one trade. |
| Show Orders TP/SL Line | Display short segments of the Take Profit and Stop Loss levels for each order if they have been installed. |
| LineWidth | The thickness of the line from the opening price to the closing price. When more than 1 style line is longer, always “Solid Line.” |
| LineStyle | The style of displaying the line between the opening price and closing of the order at LineWidth 1: Solid Line, Stroke Line, Dotted Line, Dotted Line, Double Point Bar. |
| Fontsize | The size of the profit/loss font on orders. |
| LabelCorner | Choosing a screen angle to show a total profit on the specified symbol: from top left, top right, bottom left, bottom right. At No. |
| TextFont | Text display font. |
| Colors ==> Color setting | |
| BuyColor | Color for Triangle Shopping. |
| SellColor | Color for The Sales Triangle. |
| WinColor | Color text for deals that have been closed in plus. |
| LossColor | The color of the text for unprofitable trades. |
| LabelColor | The color of the label total profit. |
This indicator is an excellent tool in the recruitment of a professional trader. And certainly allow you to rise to a new, better level.
Simplicity is the key to success!