


Closed orders (in the form of triangles and lines between the opening and closing price) show visually the price movement and the time period that passed the order from the opening to its closing. When advisers work, this display occurs, but sometimes not always, when manually trading once through time. If the user wants to look at this gap, they will have to do more – manually transfer orders from the Account History tab with the Shift key clamped on to the graph. Many people do not know about this method and have to carry out the transfer of each individual order sequentially, which is quite inconvenient.
DaVinci Show history orders on chart to graphically display all closed orders on the graph will help simplify this task. You just need to set it on a schedule and set the necessary settings.
The main advantage of this script, compared to analogues is the ability to display over the closing price the profit/loss of user orders in the form of text tags, as well as to calculate the total profitability/loss of a group of orders closed on one candle (a very useful feature when used in the trading of a grid of orders, martingale). And an added benefit is the ability to set the type of line and its thickness.
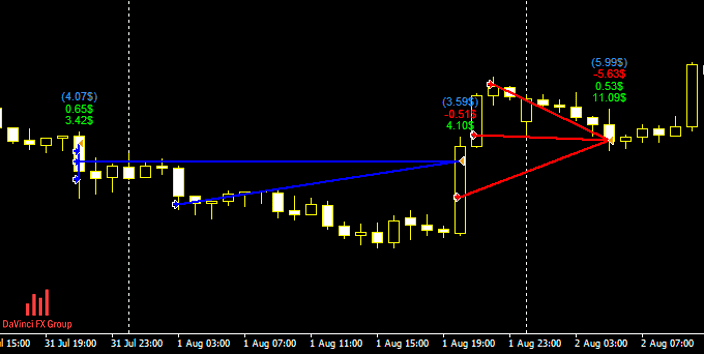
An example of how the script works:
Transfer the script to one of our main trading accounts, where the grid Advisor trades:
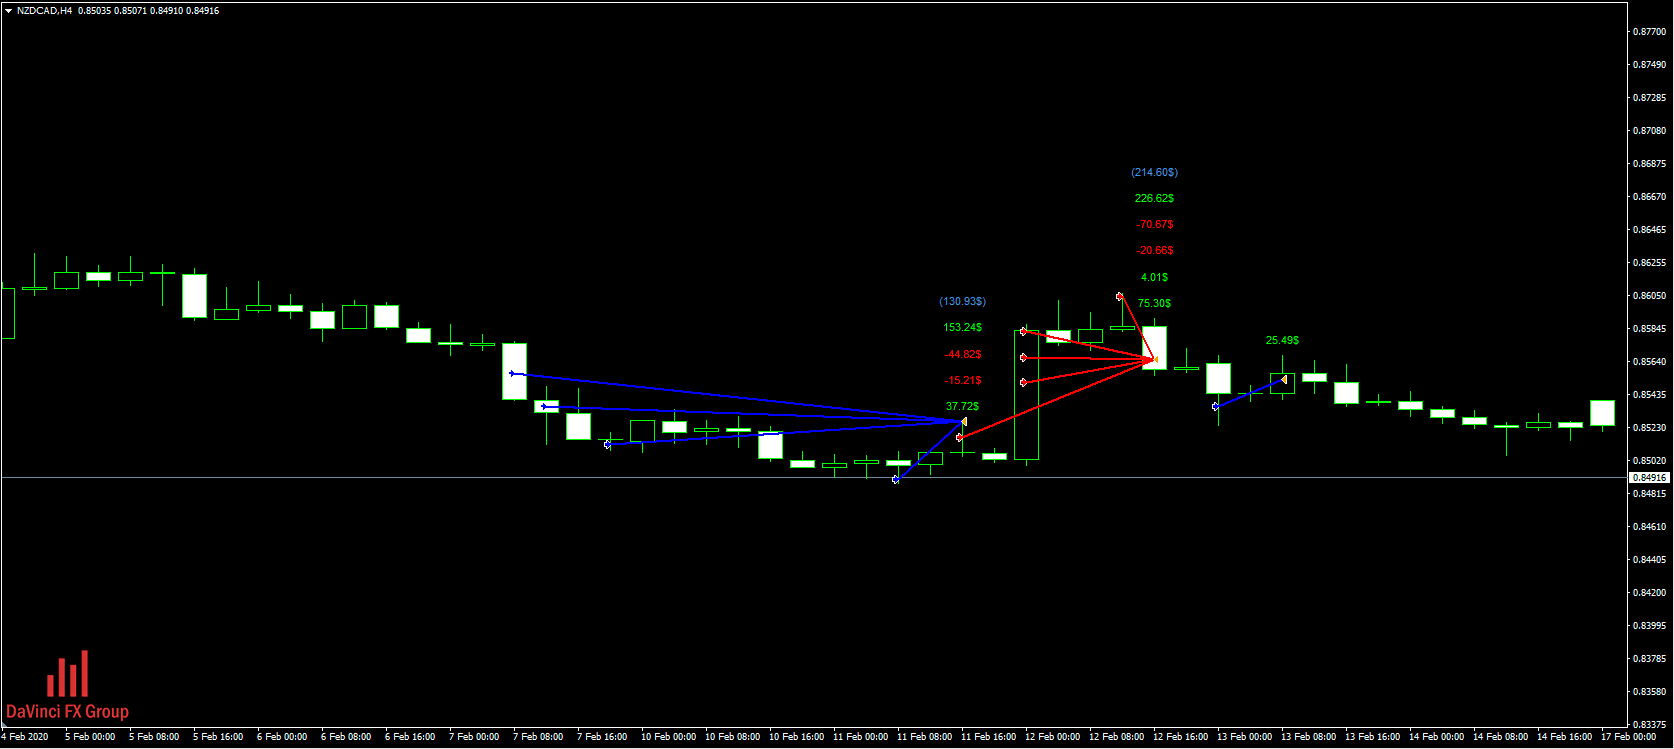
As can be seen in the screenshot, we had closed at the beginning a group of 4 orders in the purchase with a total profit of $130.93, and immediately after the net was opened in the sale of 5 orders, which closed with a profit of $214.6. Then there were single orders in the purchase with a profit of $25.49, it turns out that all orders in total gave us a positive result. With this analysis, we do not need to raise the history of orders manually, all transactions and their profits can be seen immediately on the chart.
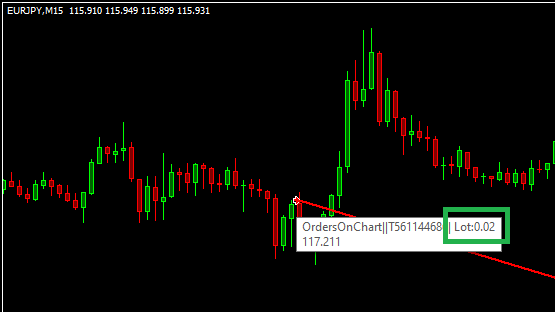
To find out the lot of the trading order, you need to bring the mouse to the triangle of opening this order, there will be an information window with the name of the object and the value of the trading lot:
Below you can see that the script downloaded information on the 2001 order:

This tool can be used not only on their charts. For example, you have received the password of an investor from someone else’s trading account you are interested in, with the help of our script you will be able to immediately evaluate its trade.
For a more detailed analysis of trading history with a graph of the profit of your trades, you can use our DaVinci Show History Orders
Setting up the script:
| Main Options > | |
| Delete Old Objects | Remove all objects from the graph before using the script. |
| Order Magic Number. -1 – all | The ability to select the Magic Number of displayed orders, or set the value of -1, then the chart will appear all orders of the current currency pair. |
| Show Total Candle Profit | Display the text of the total profit of trades over each candle, if it was closed more than one transaction. |
| Show Orders TP/SL Line | Display short segments of the Take Profit and Stop Loss levels for each order if they have been installed. |
| LineWidth | The thickness of the line from the opening price to the closing price of the order. With a thickness of more than 1 style line LineStyle is always “Solid Line.” |
| LineStyle | Line display style between the opening price and the closing price of the order at LineWidth 1: Solid Line, Stroke Line, Dotted Line, Stroke Line, Double Point Scoreline. |
| Fontsize | The size of the text font to display profit/loss on orders. |
| TextFont | Text display font. |
| Color setting | |
| BuyColor | Color for the Shopping Triangle icon, as well as the line between the closing and closing prices of orders. |
| SellColor | The color for the Sales Triangle icon, as well as the line between the closing and closing prices of orders. |
| WinColor | Color text for deals that have been closed in plus. |
| LossColor | The color of the text for unprofitable trades. |


