


Содержание
Currency exchange, like any other, is first of all people. All its participants have absolutely their purposes, namely, some buy currency for operational activity, as banks do, and some are engaged in speculative trading. Everyone has his own interests and views, but in the process of deciding whether to buy or sell, everyone is guided by one thing in common – the price chart. It is the only and the most accurate source of information, showing the real value of assets and confidence in it by market participants.
The price chart is a visual representation of the value of a trading asset, which is formed by collecting data based on the purchases and sales of bidders. It takes into account all the processes that occur during the trades, and with the help of special platforms, the trader receives a visually clear and accessible form for analysis from the endless stream of quotes.
That’s why the analysis of forex charts is an integral part of the trading process, which is impossible to bypass. In this material, we will tell you how to read candlesticks on the chart, what you need to do, and how to quickly orient yourself in the market environment by understanding the fundamentals of price formation.
Types of charts in Forex
Trading on the currency market takes place mainly using the two most popular platforms, namely Meta Trader 4 and Meta Trader 5. They support three types of trading charts:
- Lines;
- Bar;
- Japanese Candlesticks.
Line Graph
Lines – this is the simplest type of charting, where the basis is the price closure points for the selected timeframe, which are connected by a line. That is why it is most often called “Linear”. In practice, it is used very rarely and only for visual quick estimation, such as confirmation of popular reversal or trend continuation patterns. Such a graph looks as follows in MT4:
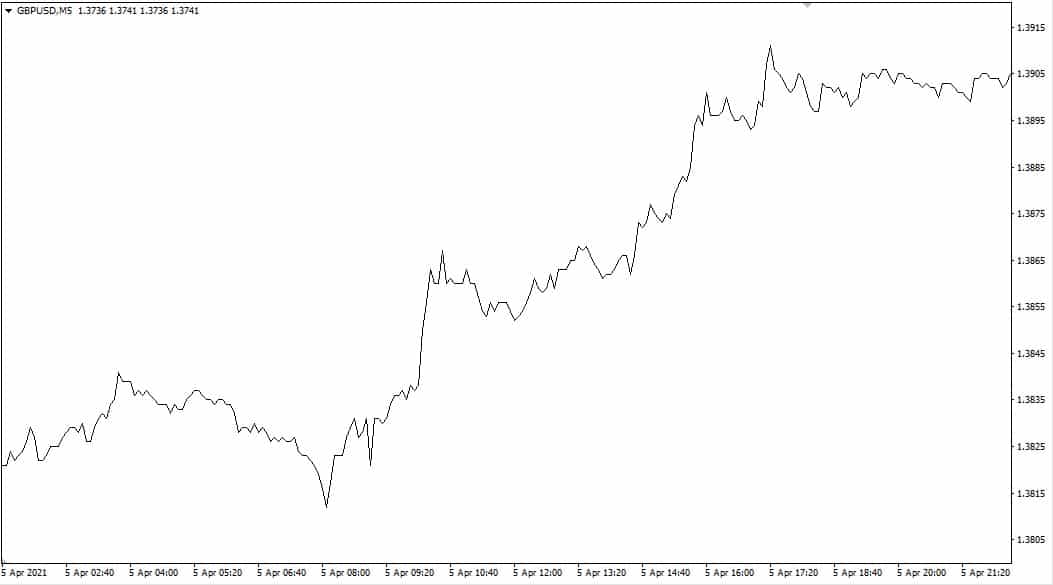
Line charts do not contain any qualitative information, because you will not see anything but closing prices in this visual format. Therefore, it is impossible to perform any type of analysis, except for graphical and indicator analysis
Chart Bar
Bars are a type of chart displayed as vertical bars with horizontal bars on the left and right sides. It is based on four types of prices: open, close, high, low. In contrast to the linear one, it shows not only how the price closed, but also how it behaved during the selected time interval. It allows you to see how much the market deviated, its dynamics before the timeframe came to an end.
The dashes turned to the left indicate the opening price and to the right the closing price for the set time interval.
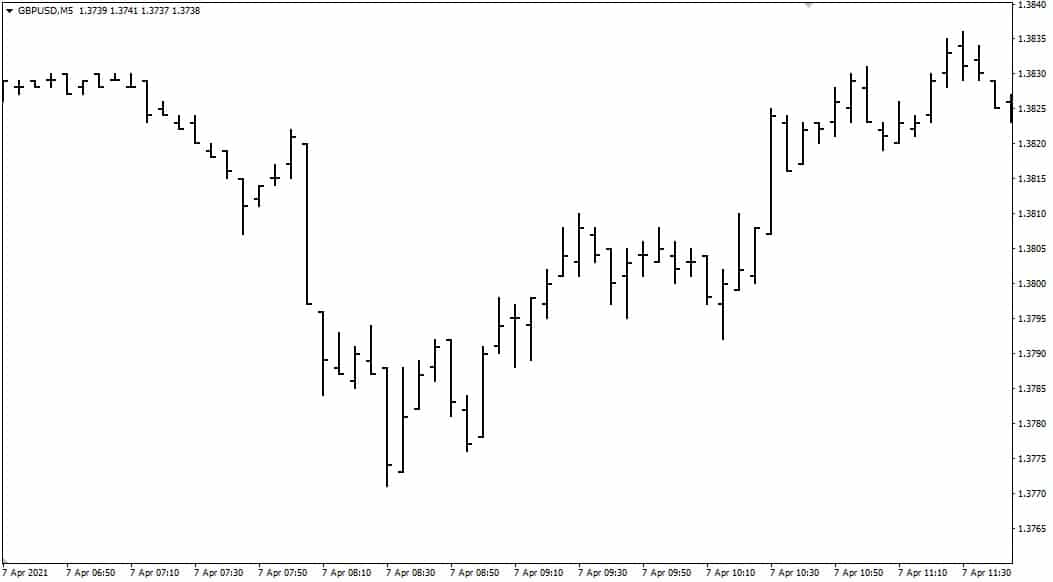
The fourth generation of the platform makes the display of bar charts in an uncomfortable visual form, name exactly as it is described in classic stock market textbooks. However, most platforms can make adjustments by making the chart display different colors for bars that have a closing price higher than the opening price and vice versa.
The bar chart allows for full-fledged graphical and technical analysis, moreover, you can use it to find uncomplicated combinations.
Chart Japanese Candlesticks
The candlestick chart is the simplest and most convenient way to display prices, which allows you to see key information: opening, closing, minimum and maximum prices for the selected interval. It got its name because of its appearance.
They are called Japanese because the basics of working with them were introduced by Steve Nison after his trip to Japan. It was there he encountered a booklet that introduced the world to a new direction of price forecasting – the candlestick analysis. It looks as follows:
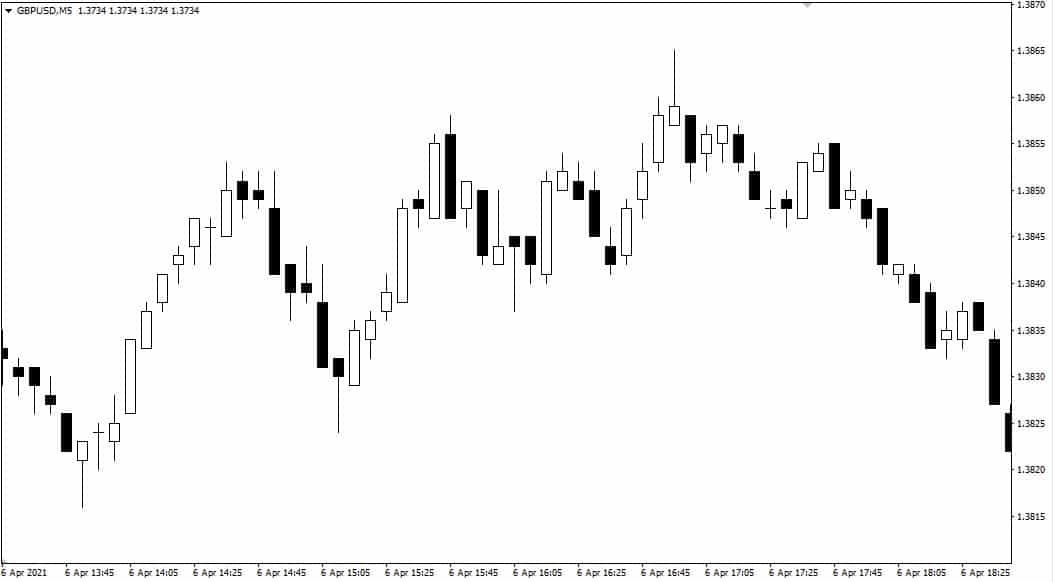
Candlesticks are most often used by traders in trading. The main reason is its convenient form of visualization. The color and shape of a candlestick can tell a trader a lot, namely who dominates the trades at a given time.
It is important to note that although the three types of charting considered are basic, they are far from being the only ones. For example, using online platforms and highly specialized programs, the following types of charts can be built: Renko, Kagi, X-Zero, Heiken Ashi, Delta and others. They can be partially reproduced in Meta Trader, but this will require auxiliary indicators, scripts and, in some cases, Expert Advisors.
If you plan to work with charts it is not necessary to use a stationary MT4 trading terminal. First, there is a smartphone version, and second, you can study charts online at https://www.mql5.com/ru/trading.
How to customize the style of graph display

When studying educational literature, beginners usually encounter black and white charts, while in the Metatrader 4 platform they are green on a black background. This is confusing and makes it difficult to learn. However, you can set them up on your own. To do this, you just need to use the right mouse button to call an additional menu on the chart, going to “Properties” or use the hotkey F8.
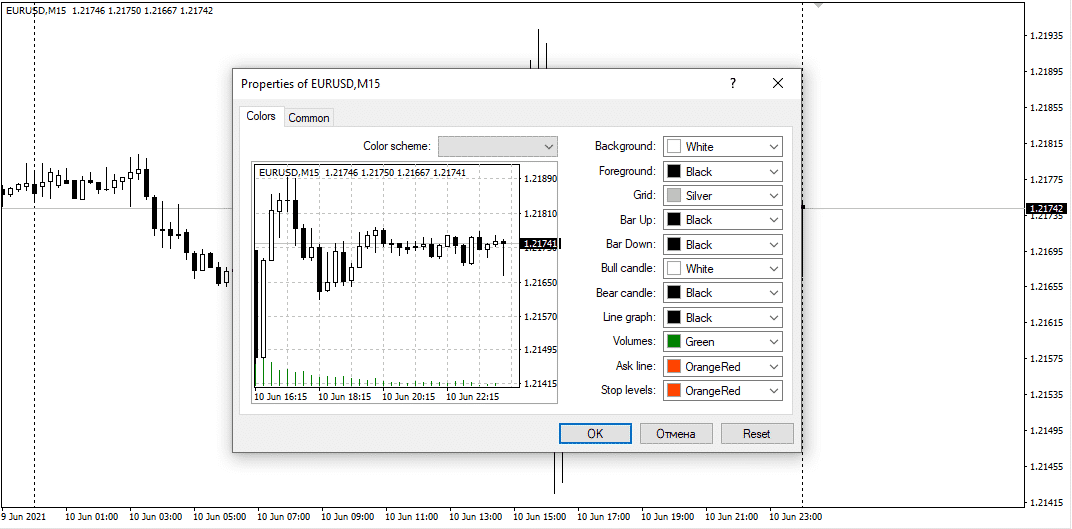
In the window that appears, you will be able to choose one of the three ready-made visual schemes, as well as customize the chart. It is possible to change the colors of candlesticks, background, text, levels, and volumes. Also in the general settings, you can adjust the scale, remove or enable the grid with period separators.
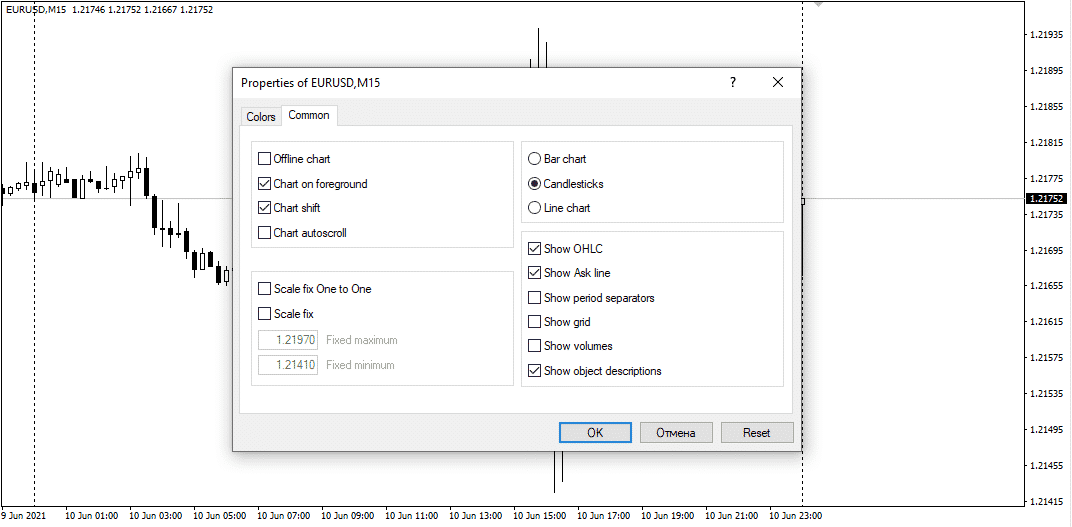
As an example, you can make a pretty good alternative to the standard candle color scheme:

You can use our free DaVinci Chart Templates Script to find a suitable chart template from our offer.
How to read candlesticks on a chart
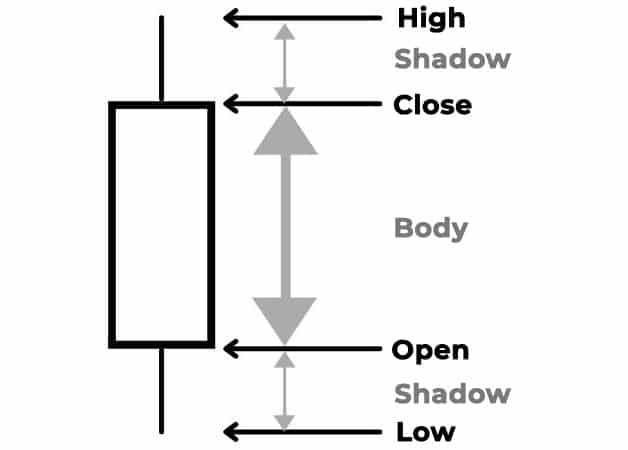
Before you learn how to do candlestick analysis on a chart, you need to understand the basics in more detail. The basic element of this type of construction is a candle. It consists of the following elements: the body and the shadows.
The body of the candlestick is the distance that is formed between the opening and closing price for the selected time interval. The shadows in turn show the price movement from the open/close prices to the recorded highs and lows. Schematically, all the prices displayed by a single candlestick look as follows:
It is important to understand that there are three types of candlesticks: bullish, bearish, and Doji. A bullish candlestick indicates the dominance of buyers, which means that its closing price is higher than the opening price. A bearish candlestick shows the dominance of sellers, so the closing price is lower than the opening price. Dodgy candlesticks are candlesticks in which the candlestick body is missing because the opening and closing price were at the same level. In the traders’ environment, they are often called Doji. Schematically, they look like this:

Fundamentals of candlestick chart analysis
The basis of any type of analysis is statistics, which can reveal the pattern between an event in the past and the possibility of its recurrence in the future. The candlestick chart allows us to find a huge number of patterns, which allowed us to create a separate area of work with charts – candlestick analysis. It is based on candlestick patterns.
By a candlestick pattern is meant a certain appearance of a candle or a combination of candles, after the appearance of which there is the realization of a certain scenario (trend reversal, continuation of the trend, pause, and uncertainty).
In classical analysis, there are more than twenty such patterns and their combinations of about 60, and if you find a certain candlestick, which is statistically recurrent, it can also be considered a pattern.
It is important to note that there is a conditional division of candlestick patterns according to the difficulty of their detection – into easy and complex. The combinations of one or two candlesticks are considered as easy. The following candlesticks are considered to be the easy ones:
- Hammer;
- Hangman;
- Inverted hammer;
- Shooting star;
- Pinbar;
- Inner Bar;
- Outside bar;
- Absorption;
- Harami;
- Dark Clouds.
Complex patterns consist of three or more candles. The most famous are the following:
- Morning Star;
- Evening Star;
- Abandoned baby;
- Three stars;
- Thrusting;
- Piercing Line;
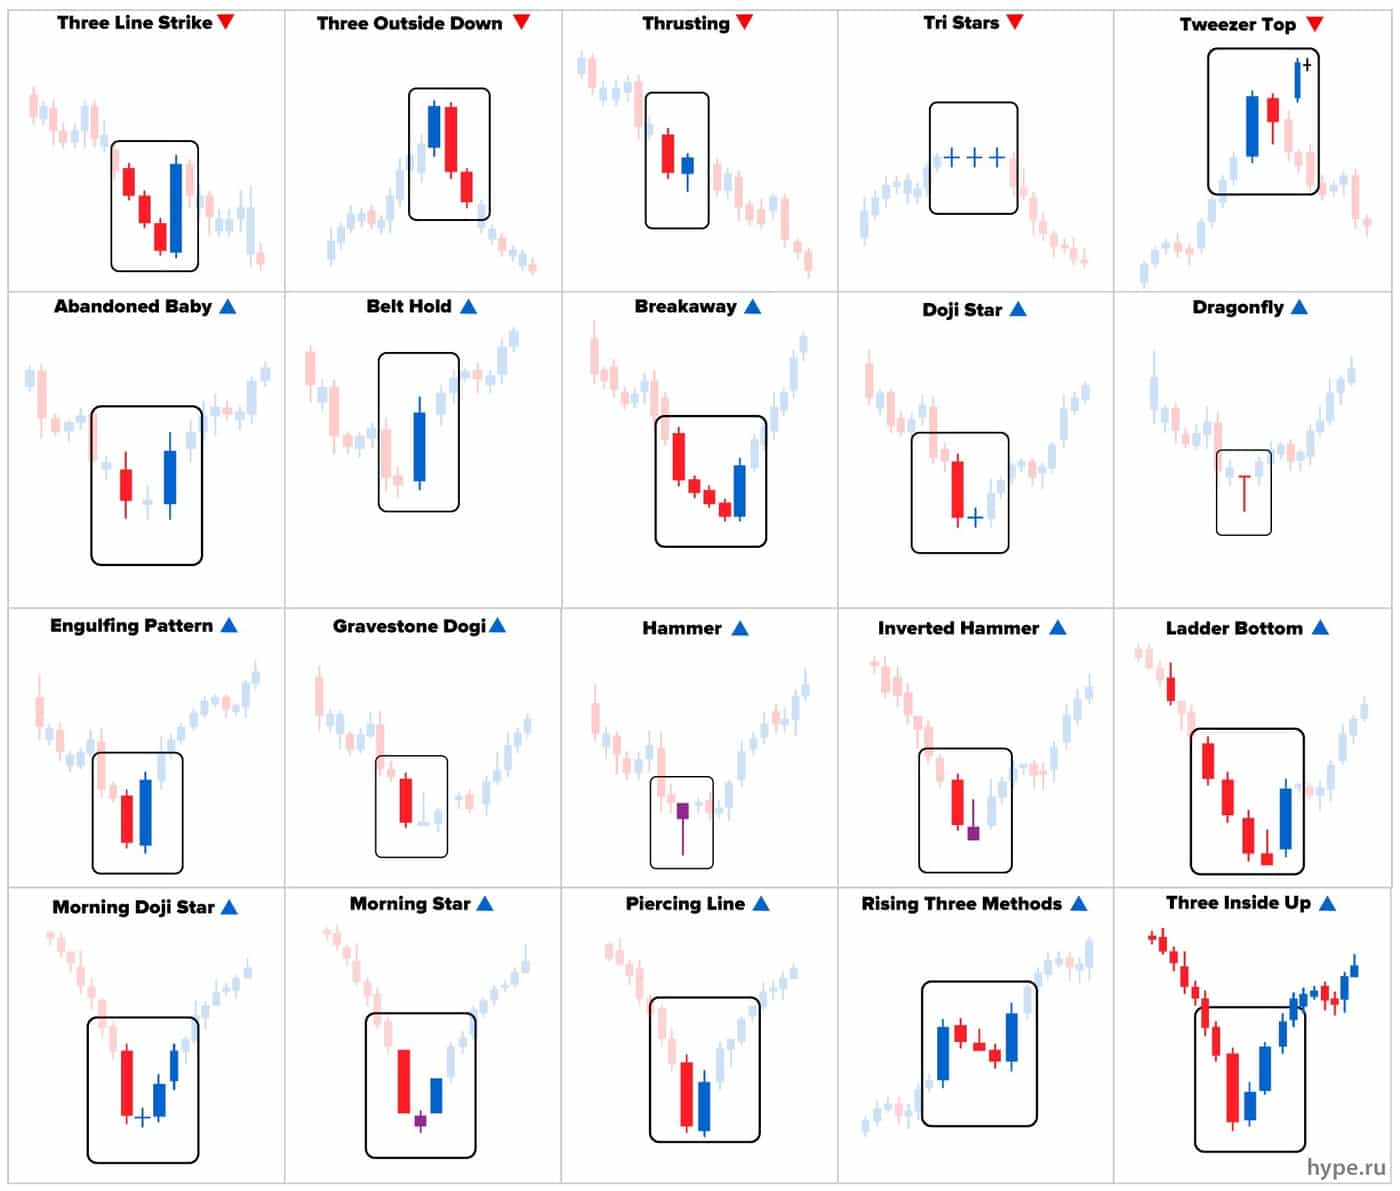
The figure below shows the most popular patterns:
There is no fundamental difference between the effectiveness of easy and complex patterns. Although the latter occur less frequently and are more difficult to determine, the effectiveness of a pattern depends on both the particular trading asset and the time interval.
Consequently, we should not disregard simple patterns and focus exclusively on complex ones, because only testing can tell us about their effectiveness.
Conclusion
In conclusion, it should be noted that the candlesticks and the price are the main data source with which the trader works. That is why absolutely everyone who is planning to connect his or her life with trading should learn to read it.


