


Содержание
Fundamental analysis in the arsenal of a professional trader occupies one of the most significant places. One of the interesting areas of this method is the analysis of the reports Of Traders, analysis of these reports can give the trader a good idea of future significant changes in the market. These reports are published weekly by the U.S. COMMODITY FUTURES TRADING COMMISSION, an independent U.S. federal agency that oversees exchange activity. The reports reflect all data on transactions concluded on foreign exchange futures, the volume of which is at least 400 contracts during the trading day. This data will be especially useful for strategic investors and traders applying medium- and long-term trading strategies.
DaVinci Commitments of Traders Data was developed by the DaVinciFX Group team in conjunction with Trade Like a Pro. It allows you to replicate these reports directly to the Meta Trader 4 terminal, thus simplifying the process of obtaining such important data for a professional trader. Now all the information about the transactions made by the major players of the international forex market (Foreign Exchange) will be available in your trading terminal. That in turn is a tangible competitive advantage, in the harsh trading conditions of the real foreign exchange market.
At the same time, the indicator has a great variability of settings graphic display of reporting data, which will adjust it to its own needs and views. The resulting graph can be further analyzed using standard MT4 indicators. This opportunity opens up unlimited potential for the trader to identify statistical patterns in COT reports to create a unique trading system.
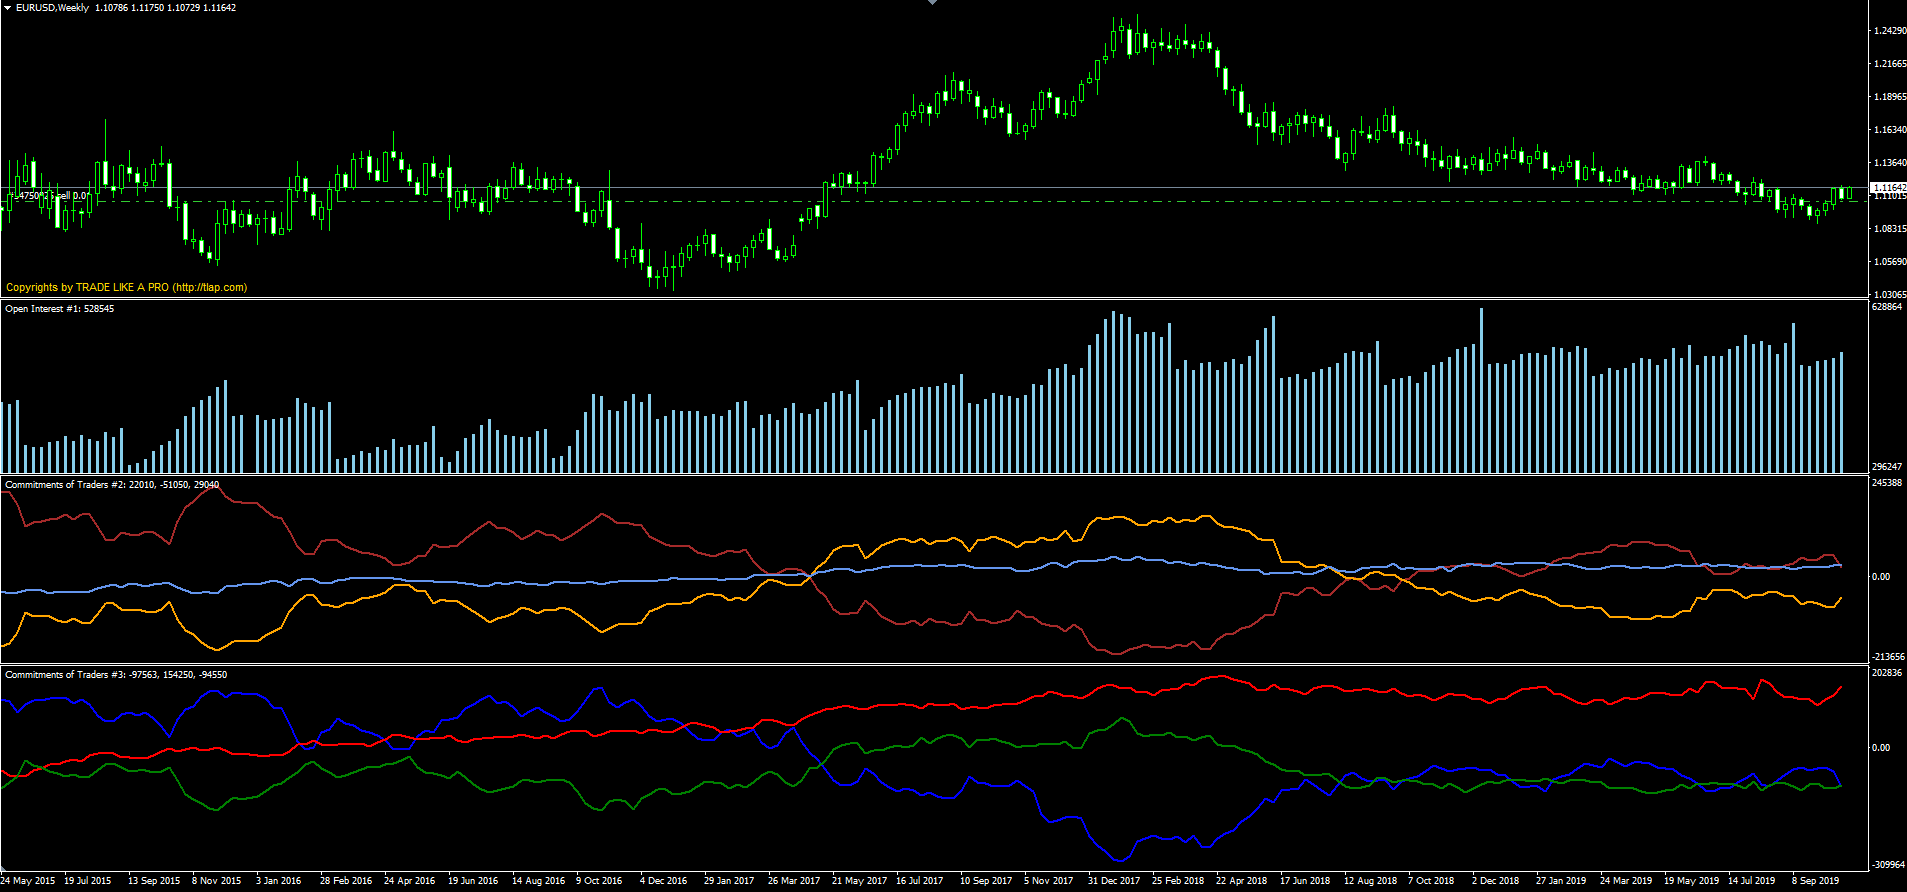
THE COT report figures are presented as linear basement indicators, divided into three windows.
This indicator works only on the following currency pairs:
EURUSD, USDCAD, AUDUSD, GBPUSD, USDCHF, USDRUB, USDMXN, USDJPY, NZDUSD
The first Indicator Of Traders Data #1 gives an idea of the volume of open positions (long plus shorts) calculated on the total Open Interest of futures and options. Unlike the volume of trades, these are held contracts, the number of which changes only after the closing of the previously acquired contract offset (reverse) transaction.

Simply put, interest is open as long or short positions on a certain currency pair as soon as they are out of position it becomes zero.
In the second window of the Indicators Of Traders Data #2 are clean positions (Long minus shorts):
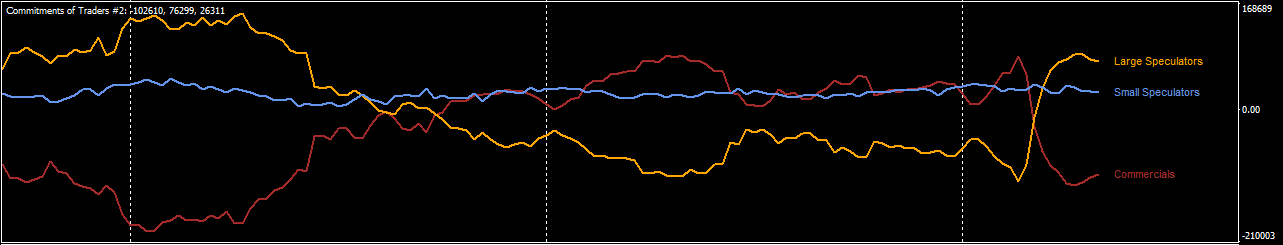
Large Speculators
Positions of large brokers, dealers, investment funds, companies and individuals buying and selling currency for speculative purposes.
Commercials
Companies with real assets that use futures to protect positions (e.g. a bank or insurance company that covers foreign currency liabilities or hedges inflationary risks).
Small Speculators
Any customers that do not fall under the category of big players.
In the third window of The Commitments of Traders Data #3 are the positions:
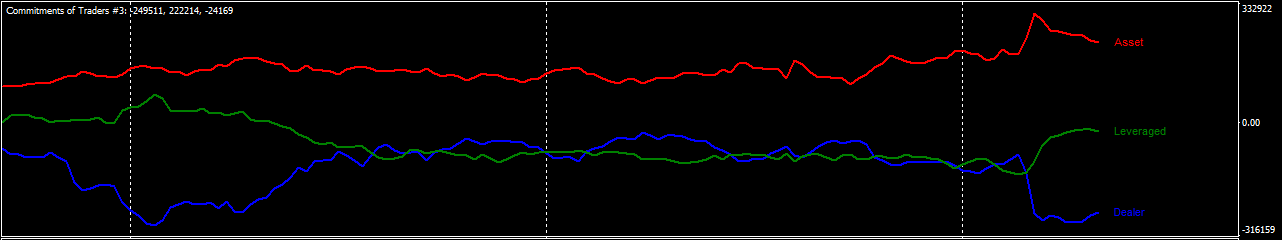
Dealers (Dealer)
Financial intermediaries opening positions in the interests (on behalf of) the client: Investment banks, brokers, etc.
Managing companies (Asset)
Pension funds, insurance companies, government structures under the Ministry of Finance, Central Banks and any other organizations that have the status of institutional investors.
Leveraged
Professional investors, hedge funds acting in their own interests on borrowed money or attracted investments.
Settings (indicated immediately for all indicators):
| > Main Settings < Basic Settings | |
| Startdate | The start date of the indicator data. The default is the first date on MyFxBook |
| Show Journal Info | Write down information about data updates, errors, etc. in the log. |
| Show Lable | Display a clickable copyright inscription in the left corner of the graph. |
| > Lines Settings < Indicator Lines Settings | |
| Line Width Open Interest | The thickness of the open interest line |
| Line Width Commercials | The thickness of the line of commercial hedgers |
| Line Width Large Speculators | The thickness of the line of large speculators |
| Line Width Small Speculators | The thickness of the line of small speculators |
| Line Width Dealer | Dealer line thickness |
| Line Width Asset | The thickness of the line of position of management companies |
| Line Width Leveraged | The thickness of the line of professional investors and hedge funds |
| LineStyle | Choosing the thickness of the line display. If the style is not Solid, the default lines will be 2. |
| > Color Settings < Line Color Settings | |
| Color Bars Open Interest | The color of the open interest line |
| Color Line Commercials | The color of the line of commercial hedgers |
| Color Line Large Speculators | Color line of large speculators |
| Color Line Small Speculators | Color line of small speculators |
| Color Line Dealer | The color of the dealer line |
| Color Line Asset | Color line positions of management companies |
| Color Line Leveraged | Color line of professional investors and hedge funds |
Deciphering the data of the indicator:
| Open Interest | Total interest on all contracts (options plus futures), summed up Open Interest on all CME exchange currency reports. |
| Large Speculations | Weekly positions of large speculators. |
| Commercials | Weekly positions of commercial hedgers. |
| Small Speculations | Weekly positions of small speculators. |
| Dealer | Weekly dealer positions – investment banks, brokers, etc. |
| Asset | The weekly positions of management companies are institutional investors. |
| Leveraged | Weekly positions of professional investors and hedge funds |
The indicator data is updated once a week after the weekend.
Trading signals of the indicator
When analyzing the results of replication of open position data, you can identify the main group of signals:
The volumes of Open Interest grow in the direction of the trend and decrease when the rate falls.
This variation is related to the feature of currency futures, it is one asset – the euro, i.e., the number of bidders increases with the growth of value, while in the fall futures is popular only with one group – hedgers.
Commercials positions always increase inversely in proportion to the trend, Large Speculators – in the direction of the trend.
The CFTC regulator puts companies with real euro currency in accounts in this group whose task is to maintain zero asset value. They buy the euro futures in short only when the value of the currency falls.
Large speculators earn on the growth of the euro (currency futures are considered as commodity asset), which explains the increase in contracts when the forecast of the growth of the exchange rate and the decrease in the share of the euro currency in the fall.
Dealers use futures to hedge positions opened on behalf of customers, acting asmarket makers (Market maker),so their actions coincide with commercials, professional investors Leveraged trade classic style of trading, gaining positions as the trend grows and fixing profits on rollbacks or falling market.
The positions of Small Speculators and management companies can be neglected in forecasts due to low activity in the Forex futures market.
Weaknesses of the Analysis of Commitments of Traders Reports
One of the main drawbacks of the COT analysis method is that the data is lagging and is not absolutely relevant. This is not a real-time report showing current positions. Between the time the data is collected and the report is published, there may be changes in the balance of power in the market. Commercial and large traders can change positions quickly. Traders should keep an eye on position change trends, not just use a weekly data report.
Resume

In summary of all the above, it is safe to say that the analysis of COT (Commitments of Traders) reports will be an excellent tool in the recruitment of a professional currency trader. First of all, it is useful because it shows the positions of major players in the market (Commercials and Large traders), who are the main drivers of the market. Position changes over time are important and can help detect reversals and confirm new trends. THE COT data should only be used to confirm the entry signal to the trading position, not as an independent trading system.


